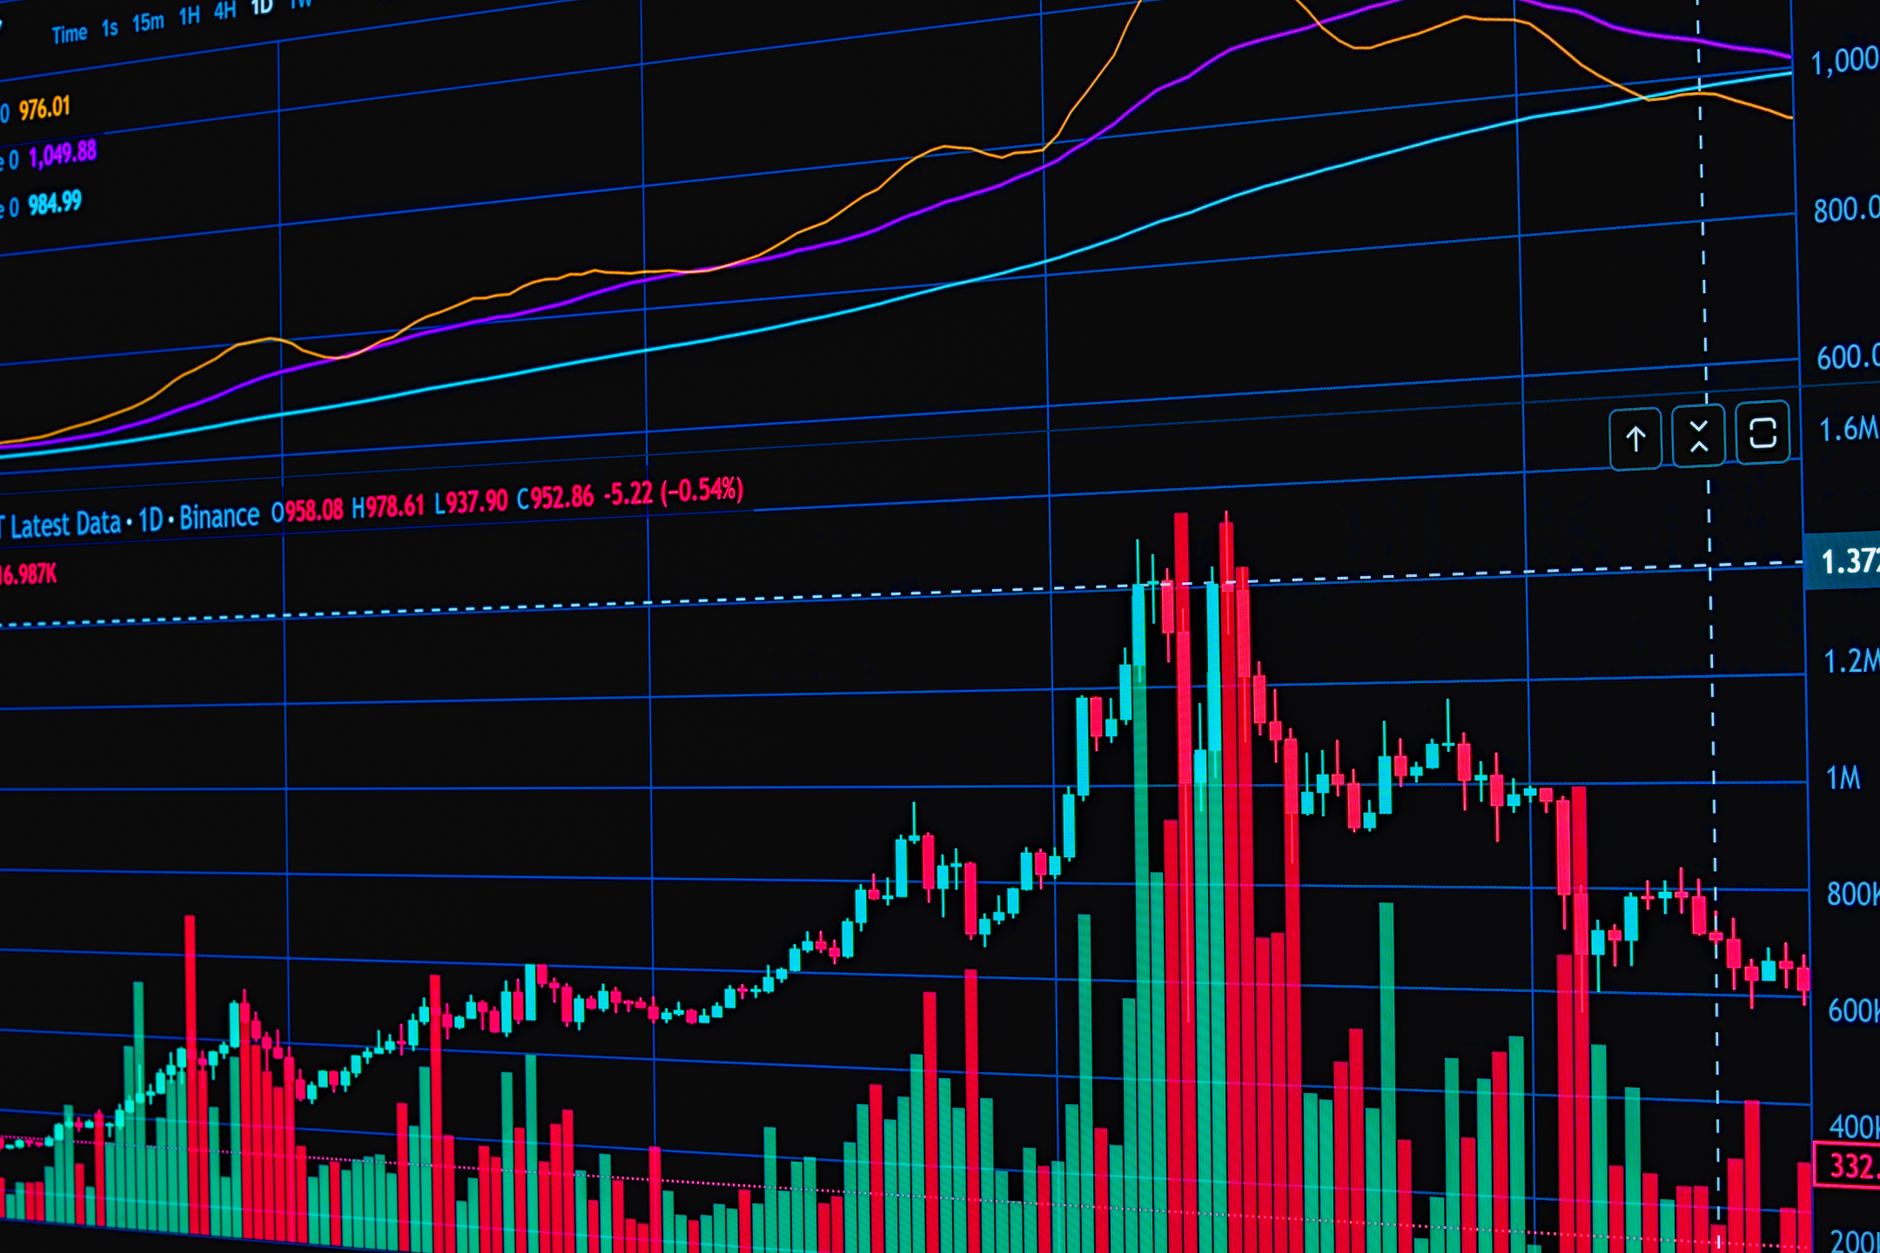
TL;DR: The total crypto market cap has followed a violent boom-bust cycle: roughly $0.2 trillion in 2020, soaring to a ~$3 trillion peak in late 2021, crashing to a ~$0.8 trillion bottom in late 2022 after the FTX collapse, then recovering steadily through 2023–2026 to sit around ~$3.5 trillion today. Bitcoin has consistently held a large share of the market, though its dominance has swung as altcoins (led by Ethereum) take turns in the spotlight.
The total cryptocurrency market capitalization — the sum of every coin and token — went from a niche corner of the internet to a multi-trillion-dollar asset class in just six years. Tracking that history reveals the cycle-driven nature of the market: sharp rallies, brutal corrections, and a long grind back to new highs.
This page provides a table-based view of key market cap milestones and a quarterly breakdown of the 2024–2026 recovery.
Market Cap by Year (2020–2026)
| Year | Market Cap (approx) | BTC Dominance % | Top 3 Coins |
|---|---|---|---|
| 2020 | ~$0.2 trillion | ~62% | BTC, ETH, USDT |
| 2021 (peak) | ~$3.0 trillion | ~40% (altseason) | BTC, ETH, BNB |
| 2022 (bottom) | ~$0.8 trillion | ~40–45% | BTC, ETH, BNB |
| 2023 | ~$1.7 trillion | ~48% | BTC, ETH, USDT |
| 2024 | ~$3.2 trillion | ~55% (peak) | BTC, ETH, USDT |
| 2025 | ~$3.5 trillion | ~58% | BTC, ETH, XRP |
| 2026 (current) | ~$3.5 trillion | ~55–60% | BTC, ETH, SOL |
Figures are approximate, round-number representations tracked by public market aggregators (CoinGecko, CoinMarketCap). BTC dominance = Bitcoin’s share of total market cap.
Quarterly Breakdown, 2024–2026
The 2024–2026 recovery was driven above all by the launch of US spot Bitcoin ETFs in January 2024, which unlocked institutional demand. Here’s how it progressed quarter by quarter:
| Quarter | Market Cap (approx) | Key Driver |
|---|---|---|
| Q1 2024 | ~$2.5T | Spot BTC ETFs launch; Bitcoin breaks prior ATH |
| Q2 2024 | ~$2.3T | Pullback; ETF outflows; halving happens in April |
| Q3 2024 | ~$2.3T | Range-bound; Fed rate-cut expectations build |
| Q4 2024 | ~$3.2T+ | New ATH; strong ETF inflows into year-end |
| Q1 2025 | ~$3.5T | Continued institutional inflows; new Bitcoin highs |
| Q2 2025 | ~$3.2–3.4T | Consolidation and volatility |
| Q3 2025 | ~$3.3T | Mixed sentiment; rotation among altcoins |
| Q4 2025 | ~$3.5T | Year-end risk-on; renewed ETF demand |
| Q1–Q2 2026 | ~$3.5T | Range-bound; institutional holding phase |
The big takeaway from 2024–2026: the market has stopped swinging between “euphoria and panic” the way it did in 2021–2022 and instead trades in a wide $3–$4 trillion range — a sign of an increasingly institutional, less frothy market where ETF flows matter more than retail hype.
What Drives the Cycles
The crypto market historically follows a roughly four-year cycle tied to Bitcoin’s halving, which cuts new supply in half every four years:
- Halving years typically build anticipation and early momentum.
- The following 12–18 months have historically been the bull phase.
- Retracements of 60–90% have punctuated every cycle.
Bitcoin dominance is the swing factor: when it’s high (55%+), Bitcoin leads and altcoins sit quietly; when it drops, “altseason” typically arrives. As of 2026, Bitcoin dominance around 55–60% reflects a market where Bitcoin — boosted by ETFs — remains the overwhelming anchor.
Related Stats
Frequently Asked Questions
What is the highest crypto market cap ever?
The total crypto market cap peaked around $3 trillion in November 2021, and surpassed that in late 2024, reaching roughly $3.5 trillion territory in 2025–2026. Exact “peak” readings vary by data source and methodology.
What percentage of the market is Bitcoin?
Bitcoin dominance has swung between roughly 40% and 62% depending on the cycle stage. As of 2026 it sits around 55–60%, boosted by sustained spot ETF inflows. When dominance is high, altcoins are relatively quiet; when it drops, “altseason” follows.
Why did the market crash in 2022?
The 2022 bear market was driven by aggressive Federal Reserve rate hikes, the collapse of major players (Terra/LUNA, Celsius, Three Arrows Capital), and the FTX collapse in November 2022, which sent the total market cap down to roughly $0.8 trillion — a ~75% crash from the 2021 peak.
Is the current ~$3.5T market cap a bubble?
Not necessarily a bubble, but markets can decline sharply regardless of narrative. The current cap is underpinned by real institutional demand through Bitcoin ETFs and mainstream adoption. Still, crypto remains volatile, and periods of heavy outflows or macro shocks can bring large drawdowns — treat it as a high-risk asset class.
How is total market cap calculated?
By multiplying each coin’s current price by its total circulating supply, then summing across all coins and tokens. Stablecoins (USDT, USDC) are included in most tallies, so the headline number includes a stablecoin layer that overstates exposure to risky assets.
This article is for informational purposes only and does not constitute financial advice.